 A well known leisure facility provider now has a far clearer picture of its energy consumption after Sinergy was called in to identify how much power was actually being used across the company’s multiple sites.
Of particular interest to the company which runs a number of leisure sites around the UK providing family fun pools, restaurants and accommodation, was identifying savings from peak lopping and overnight wastage elimination.
Sinergy, a company acquired by Marshall-Tufflex in 2010, was called in to survey the sites’ electrical demand/usage over a four week period when the facilities were operating at near maximum capacity. One of the main reasons that Sinergy was selected for the project was that it could install enough portable energy loggers to complete a parallel monitoring exercise on the 40+ distribution transformers. It was also imperative that sub-metering could take place without turning off the power supply to any facilities.
Parallel feeder cables
The easiest way to measure load current on the distribution transformers was on outgoing cables where safe access was available. It is common for 3-phase cables to be run in parallel pairs or sets of three or four. However, the span of the cables did not cause installation problems due to the fact that Sinergy e-Tracker’s flexible CTs were long enough to span the parallel conductors. The e-Trackers were magnetically clamped to the transformer casings.
 A 3-phase voltage measurement reference was accurately derived via Sinergy’s EV-TRAC synthesiser. The EV-TRAC plugs into a single phase socket and has an electrostatic phase identity feature essential in this style of measurement. Some manufacturers rely on their instruments’ software to automatically sort out the phase identity and rotation. This can be unreliable and lead to measurement inaccuracies. For example, if the power factor of one phase falls below around 0.7, then to some existing software algorithms, this phase appears more like the adjacent phase.
Peaks and troughs
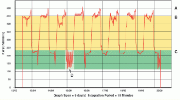
Deltrax software was used to produce demand profile graphs for the survey report, with daily and weekly graphs of multi and single parameter graphics. A kW demand profile of a swimming arena is shown in the graph (above). The survey results were dramatic, with a peak demand of more than 500kW (level A) and heavy daytime consumption (level B).
Questions were raised over why the midnight to 8.00am usage did not fall to say 15-20% (level C) as may have been expected. More puzzling were the frequent short dips from level C to level D. What was turned off to cause them and could it be extended for the whole night? Sinergy estimated that if overnight demand fell for eight hours to the 120kW level of these short lived dips, there would be a saving in consumption of some 7,000kWh per week. Tight demand control of this nature overnight for just the summer season would lead to savings of some £3,000-£4,000 in kWh unit charges in this swimming pool area alone.
 Peak demand
The peak demand of 500kW at 10.30pm on the 15th had a significant effect on the site’s monthly Maximum Demand charge and annual Capacity Charge. These two elements can represent up to 25% of an electricity bill. The question was whether peak demands at other distribution transformers coincided to push the 500kW level two or three times higher. The Excel uplink within e-Tracker’s Deltrax software package enables cumulative additions and comparisons with other sites to be made.
However, the solutions to seemingly complex questions are often easy – disable some equipment for the night and use e-Tracker to determine what effect it has on the profile. Deltrax also displays an improvement and its tariff section will work out the appropriate cost saving.
Sub-metering
Both fixed sub-metering systems with automatic data collection and portable profile recorders take their place in the forefront of the continuing battle to reduce energy costs. The latter, with its non-invasive operational characteristics, is very often the starting point in the determination of the cost reduction strategy.
It is important to remember that Sinergy sub-metering systems are intended just to identify how much power is being used – when and where. At the end of a monitoring period Sinergy can provide a complete report on the findings but does not suggest ways of making improvements – that’s up to facility/energy managers.

